Garmin Step Algorithm
Dec 6, 2018
Yesterday I wrote about using my Garmin Fenix 5 watch data to identify changes in my activity after getting a puppy. As part of that analysis I gathered several months of data, including my actual steps and a variable goal set by my watch each day. I've always been curious how this goal is calculated, but online searches haven't turned up any results. Now that I have the data, I'd like to try to reverse engineer Garmin's goal algorithm.
I know from simple observation that if I exceed my goal on a given day, the goal will go up the day after. Similarly, if I fail to meet the goal, it will go down. Seems straightforward. But beyond this, I wasn't sure exactly how my steps each day were used to update my new goal. The first step toward unraveling more of the mystery was to plot my data. I imported the data using pandas and added a few columns:
- "difference" - the actual steps minus goal steps for each day
- "goal delta" - how much the goal changed from one day to the next
import numpy as np
import pandas as pd
import matplotlib.pyplot as plt

data = pd.read_csv('step-data.txt', index_col=0, parse_dates=[0])
data['difference'] = np.roll(data.actual - data.goal, 1)
data['goal_delta'] = data.goal.diff()

fig, ax = plt.subplots()
ax.scatter(x=data.difference, y=data.goal_delta)
plt.show()

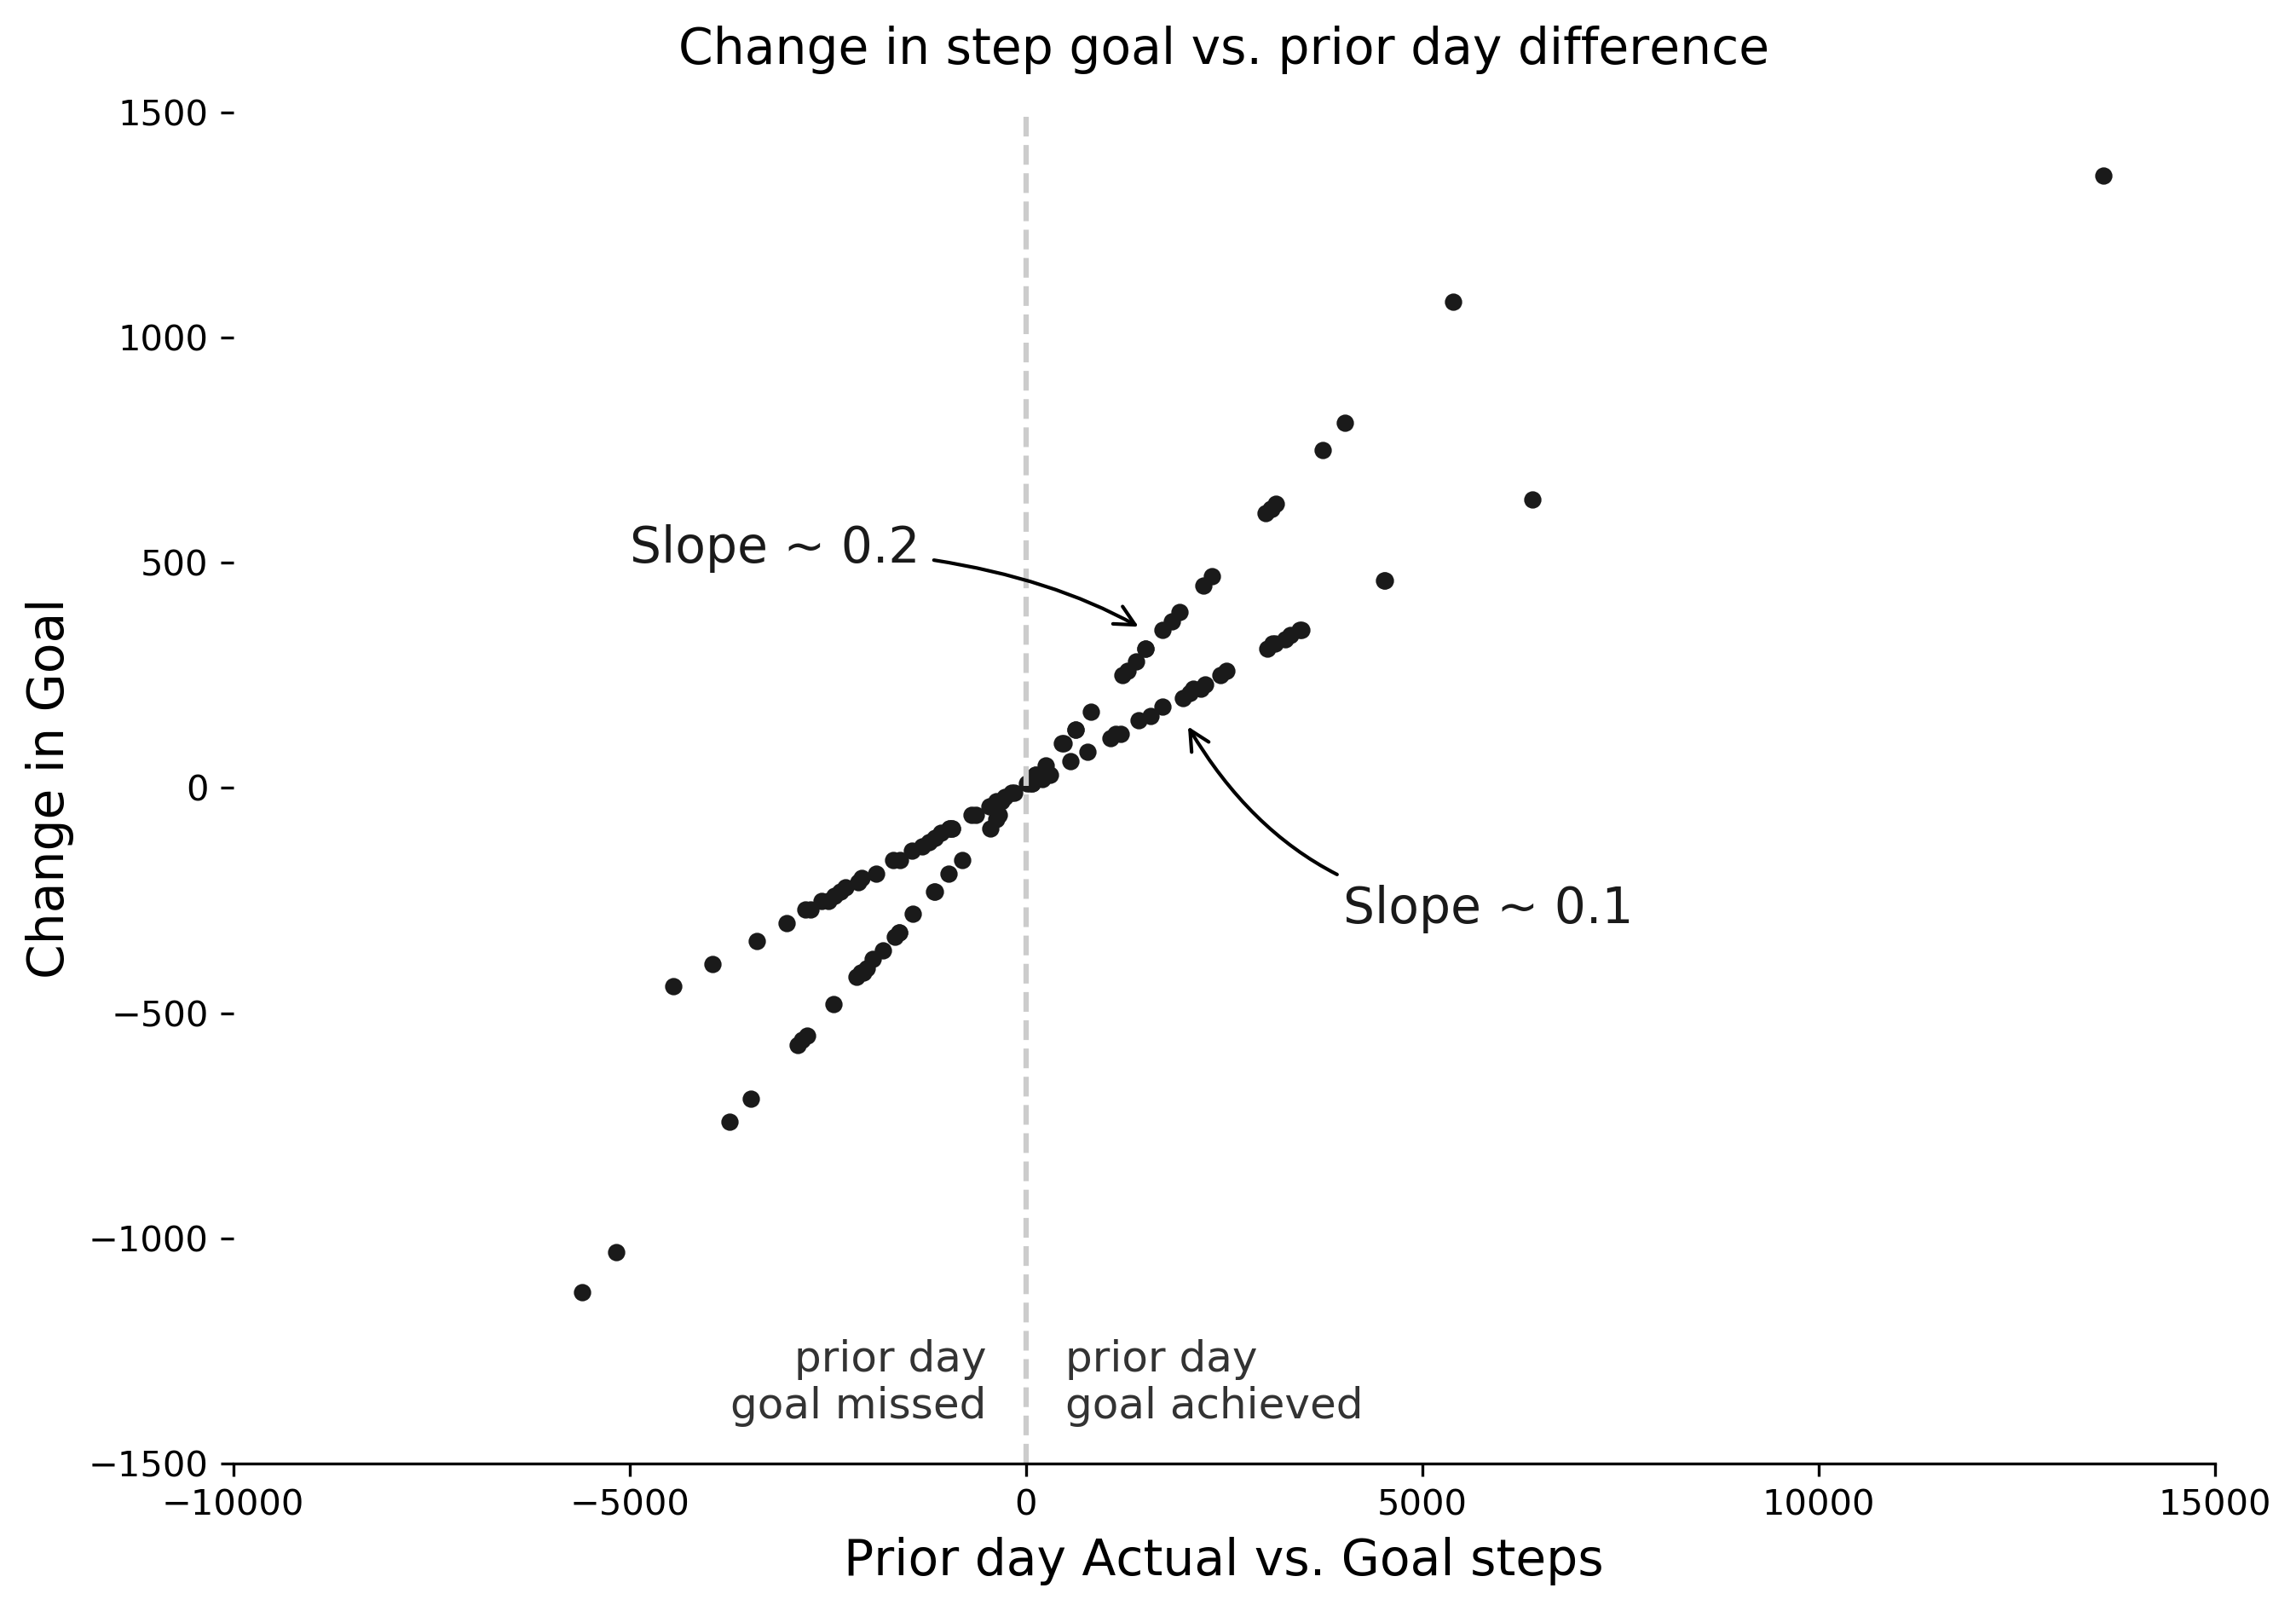
Two trend lines were apparent in the data. It looked as if the new goal was based on some fraction of the prior day's difference in a very specific way: it was roughly 10% or 20% of the prior day's difference. My next step was to try to figure out the pattern behind the multiplicative factor for each day. The easiest way to start was to look through the data with the naked eye. While it's not the most scientific approach, in this case, the quick scan was enough to discern a pattern.
The Garmin wasn't paying attention just to yesterday, but also the day before yesterday. On days where I had met (or failed) my goal the last two days, the factor was 20%, otherwise it was 10%. To confirm this I added a column called "streak", which tracked how many consecutive days I had met or failed to meet the step goal. Then I grouped the data by the streak count and confirmed that the factors were determined the way I suspected.
import itertools

group = [list(g) for k, g in itertools.groupby(data.actual >= data.goal)]
data['streak'] = [i+1 for x in group for i, v in enumerate(x)]

print(data.streak.head())

2018-07-29    1
2018-07-30    1
2018-07-31    2
2018-08-01    1
2018-08-02    1

out = data.groupby(np.roll(data.streak, 1)).factor.mean()
print(out)

1    0.102687
2    0.205000
3    0.199231
4    0.248571
5    0.200000
6    0.200000
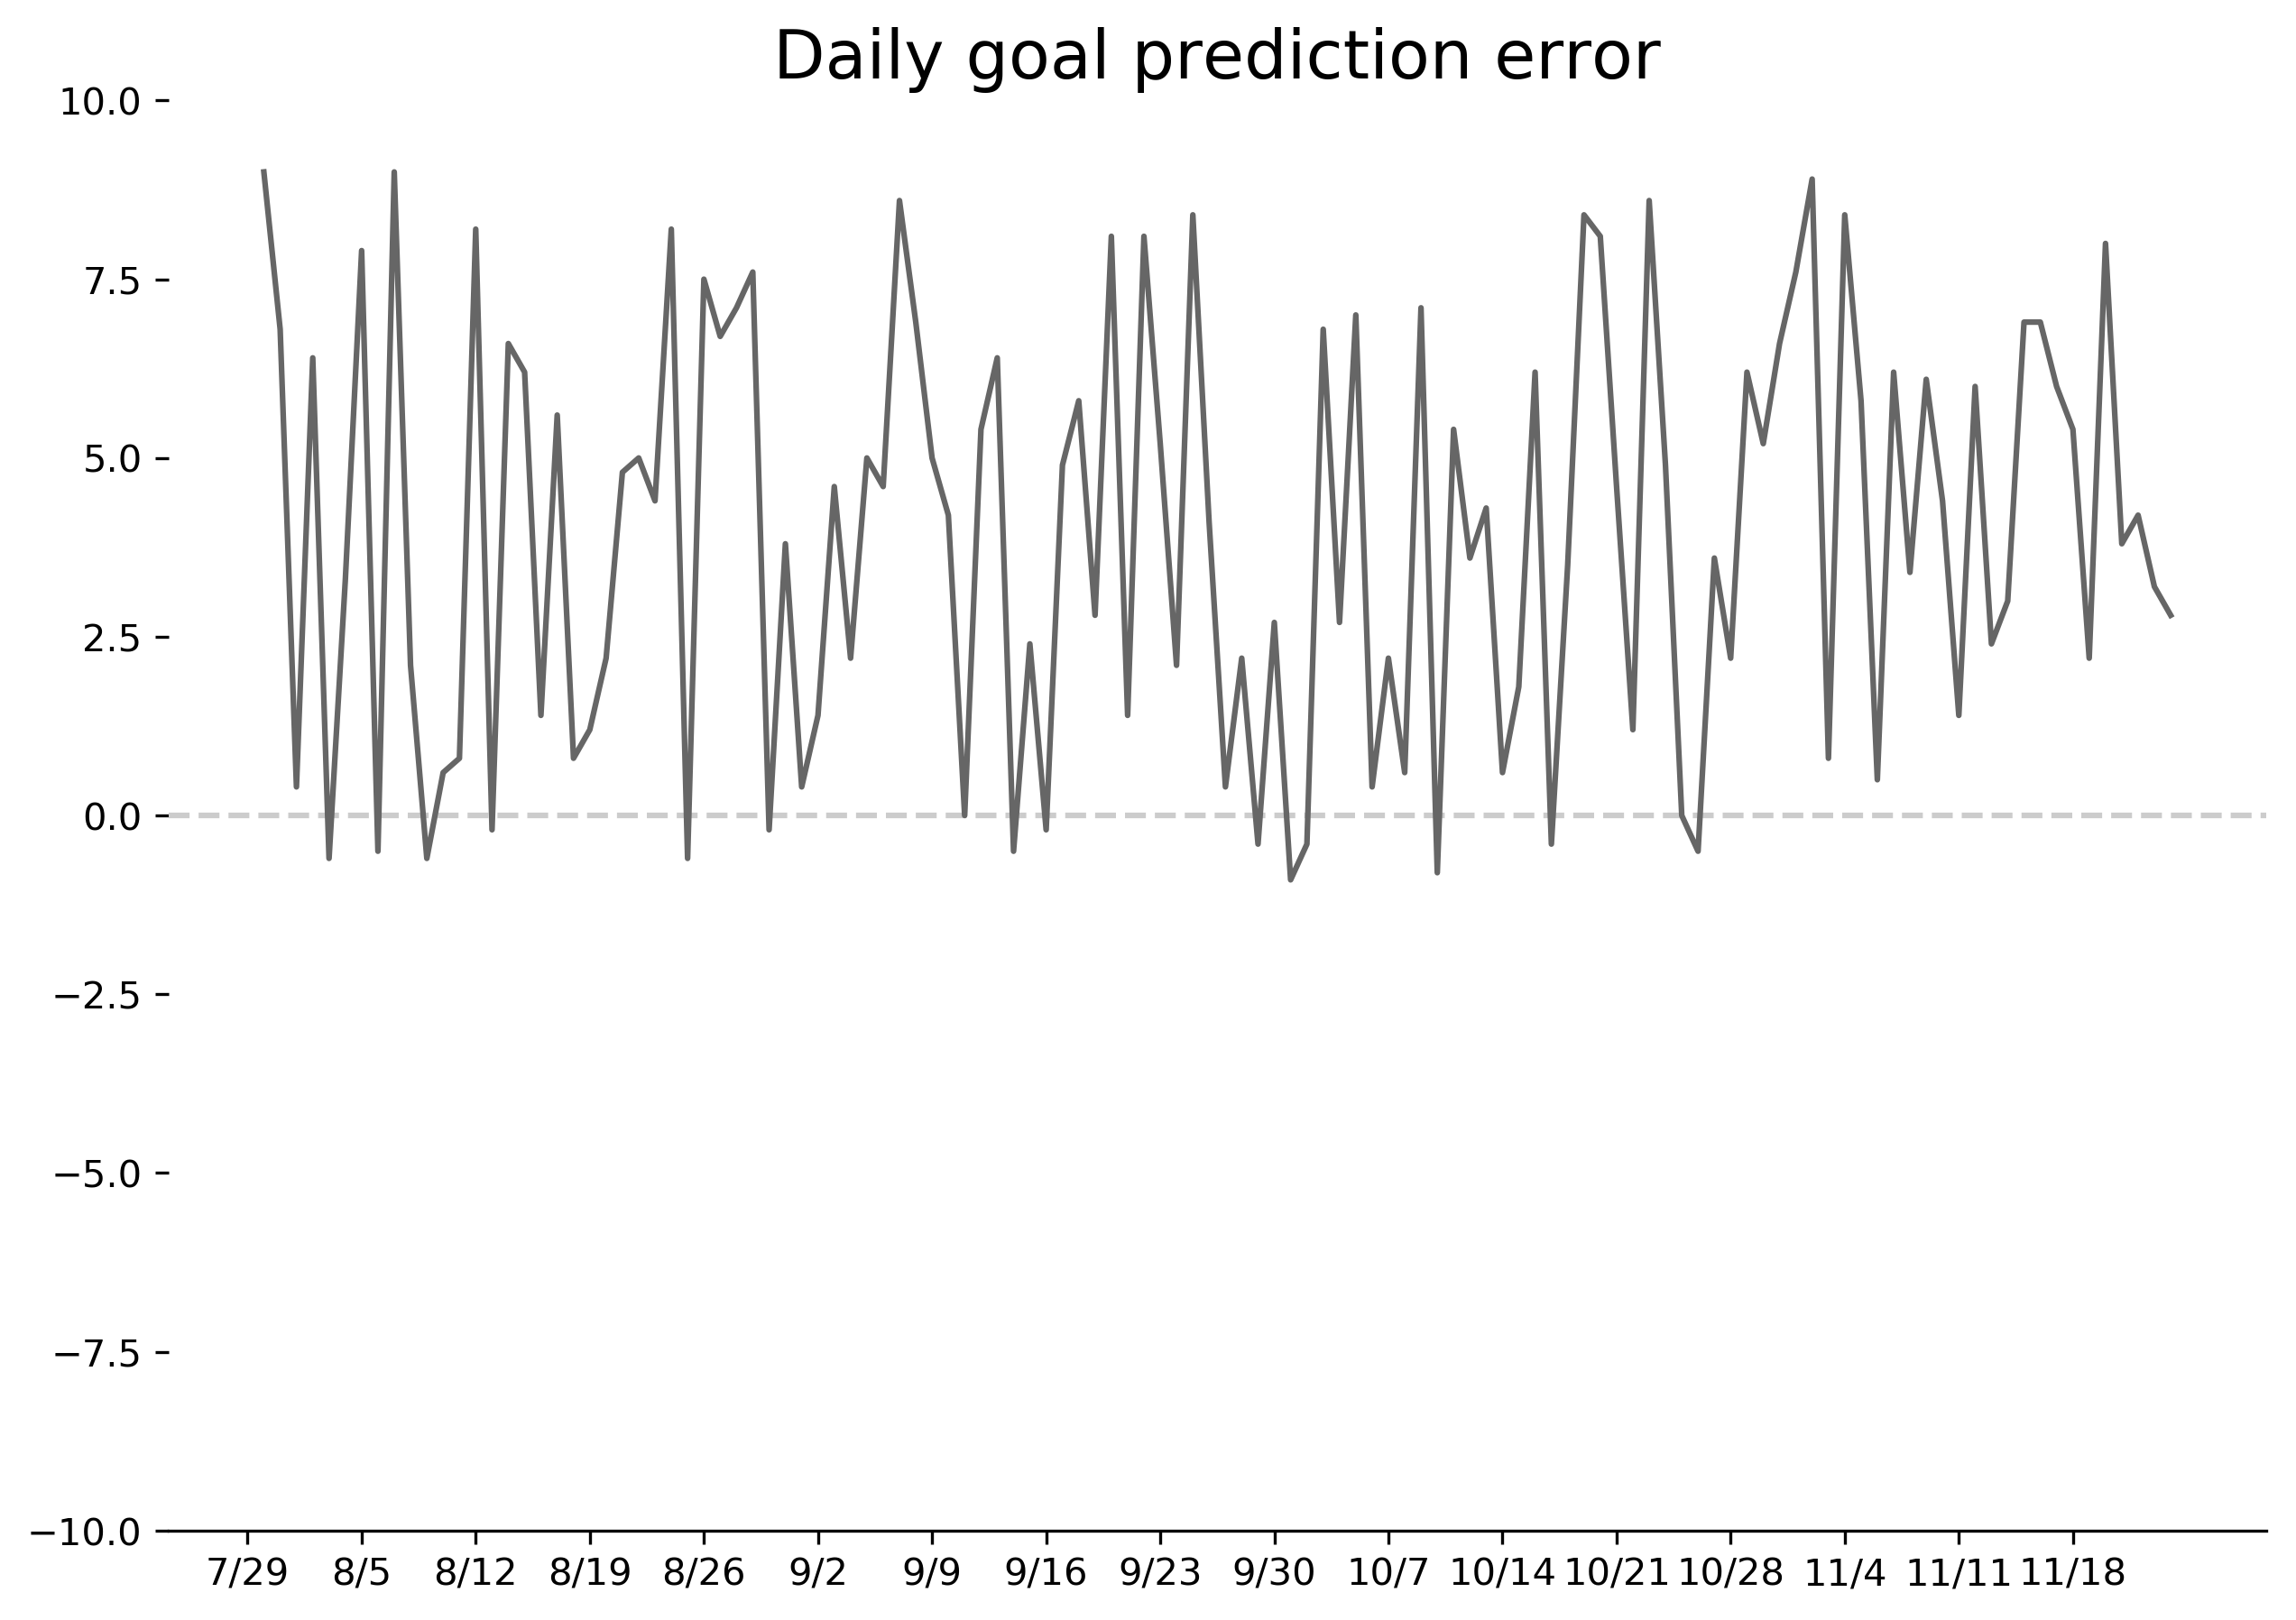
It wasn't perfect, however. For example, how could I have gotten a factor like 0.248 if I only expected 10% or 20%? Furthermore, the minimums and maximums within the streak categories were fairly widely dispersed. I suspected it wasn't as simple as multiplying the prior day's difference times a factor. I thought small values might be impacting this. For example, what if I beat the goal by something small, like 8 steps? Would that throw off the math? In any case, I calculated a first version of my best guess to start. I also used a simple visualization to gauge how accurate my predictions were. I plotted my "best guess" against the true change in goal amount, shown below.
data['factor_guess'] = 0.1 + (data.streak > 1)*0.1
data['goal_guess'] = data.difference * np.roll(data.factor_guess, 1)
data['goal_guess'] += np.roll(data.goal, 1)
data['error'] = data.goal - data.goal_guess
data.error.plot();

This is an ugly chart, but it helped me visualize how close I was getting to the real algorithm. What was most interesting in this chart was that virtually all my errors were positive: I was overshooting the step goal consistently. This suggested to me that there might be some kind of flooring function or rounding that I wasn't incorporating.
At first I thought I was calculating things too accurately. After all, my goal guesses had fractions of steps in them, like 7263.2. I appreciate Garmin's attention to detail, but I hardly think they'll bother to track fractions of steps. I also noticed that all my Garmin goals were multiples of 10, like 7150 or 7230.
>>> data.goal % 10 == 0.0).all()
True
On the other hand, I doubted this was simply a rounding issue, because all my guesses were so heavily biased toward positive values. If it were purely rounding, I'd expect my average error to be near zero. Therefore, I tried a floor function at various steps along the way to see if my accuracy would improve.
data['factor_guess'] = 0.1 + (data.streak > 1)*0.1
data['goal_guess'] = np.floor(data.difference * np.roll(data.factor_guess, 1))
data['goal_guess'] = data.goal_guess + np.roll(data.goal, 1)
data['error'] = data.goal - data.goal_guess
data.error.plot();

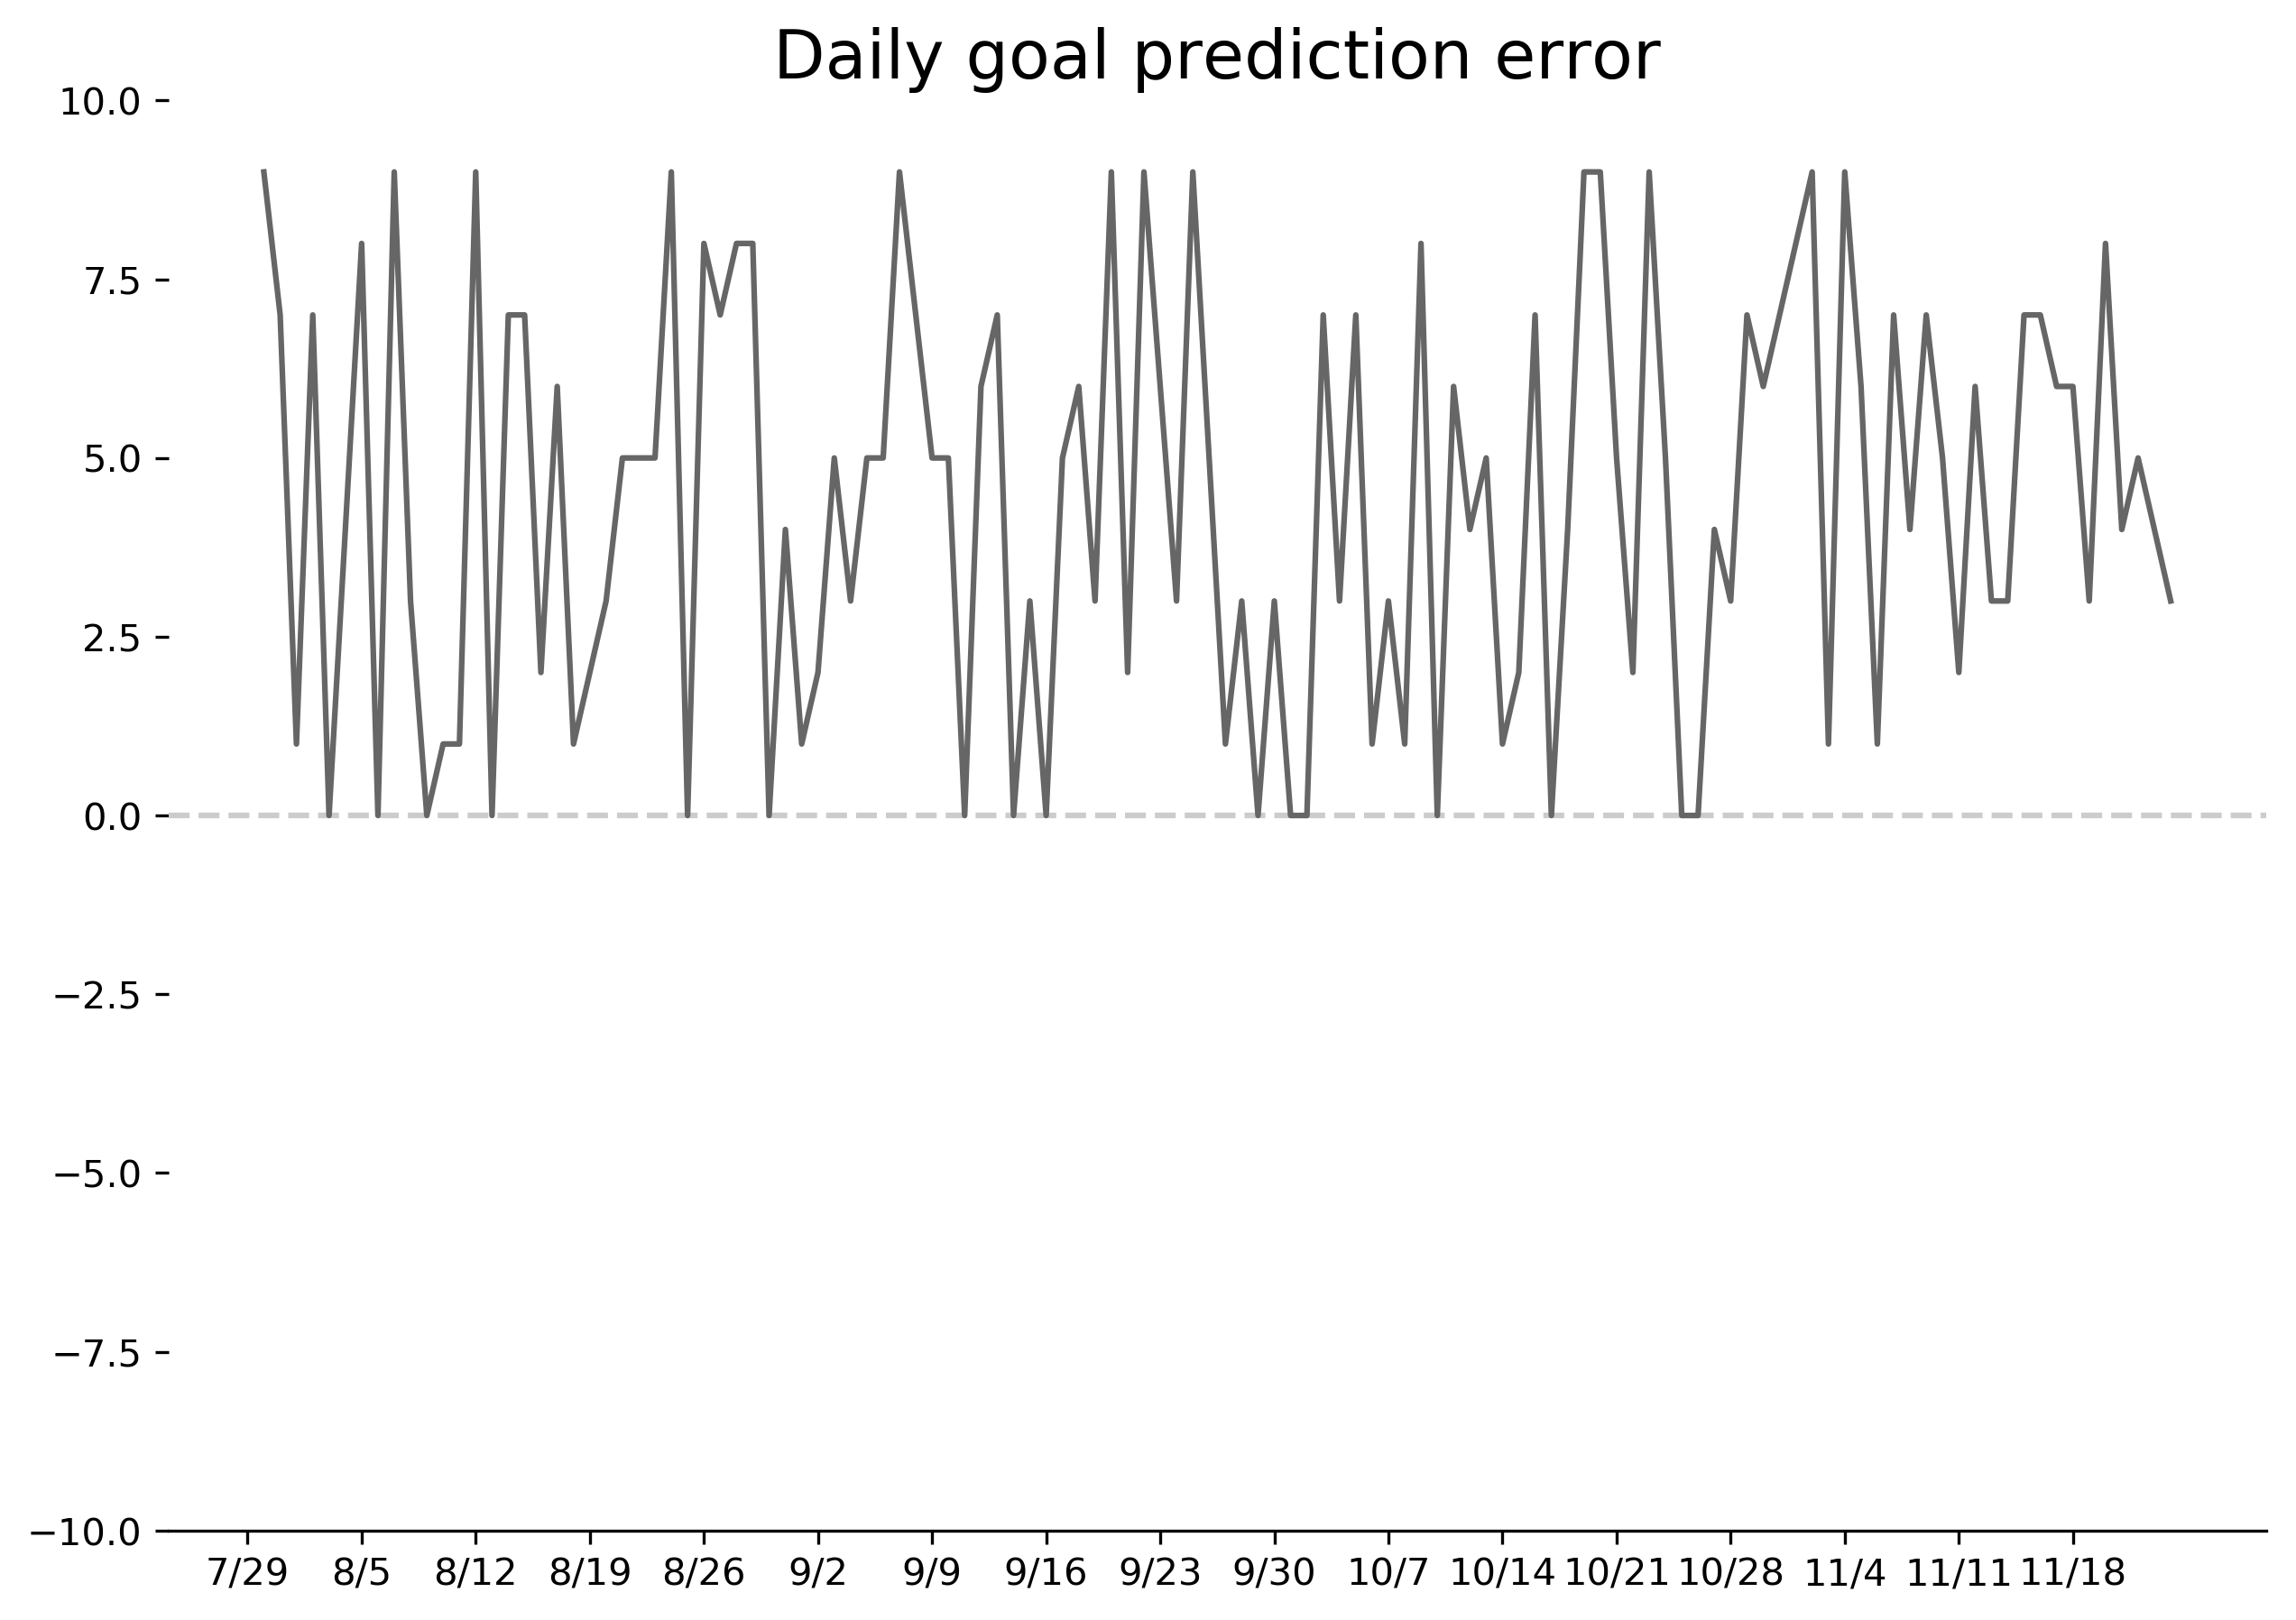
Note the new floor function on line 2. While this doesn't appear to make a huge difference, it turns out this is a key part of the algorithm. The chart looks similar to earlier, but the few negative values I had seen earlier are now "solved". Now all my errors were strictly between 0 and 10, which was a great result! That gave me a clue that a ceiling function could be involved, and indeed scanning through the sample values suggested that all I needed to do was round up to the nearest 10!
# this looks like rounding up to the nearest 10
              goal  goal_guess
2018-09-01  7120.0      7119.0
2018-09-02  7570.0      7568.0
2018-09-03  7130.0      7125.0
2018-09-04  6730.0      6727.0
2018-09-05  6980.0      6975.0

data['factor_guess'] = 0.1 + (data.streak > 1)*0.1
data['goal_guess'] = np.floor(data.difference * np.roll(data.factor_guess, 1))
data['goal_guess'] = data.goal_guess + np.roll(data.goal, 1)
data['goal_guess'] = np.ceil(data.goal_guess / 10) * 10
data['error'] = data.goal - data.goal_guess

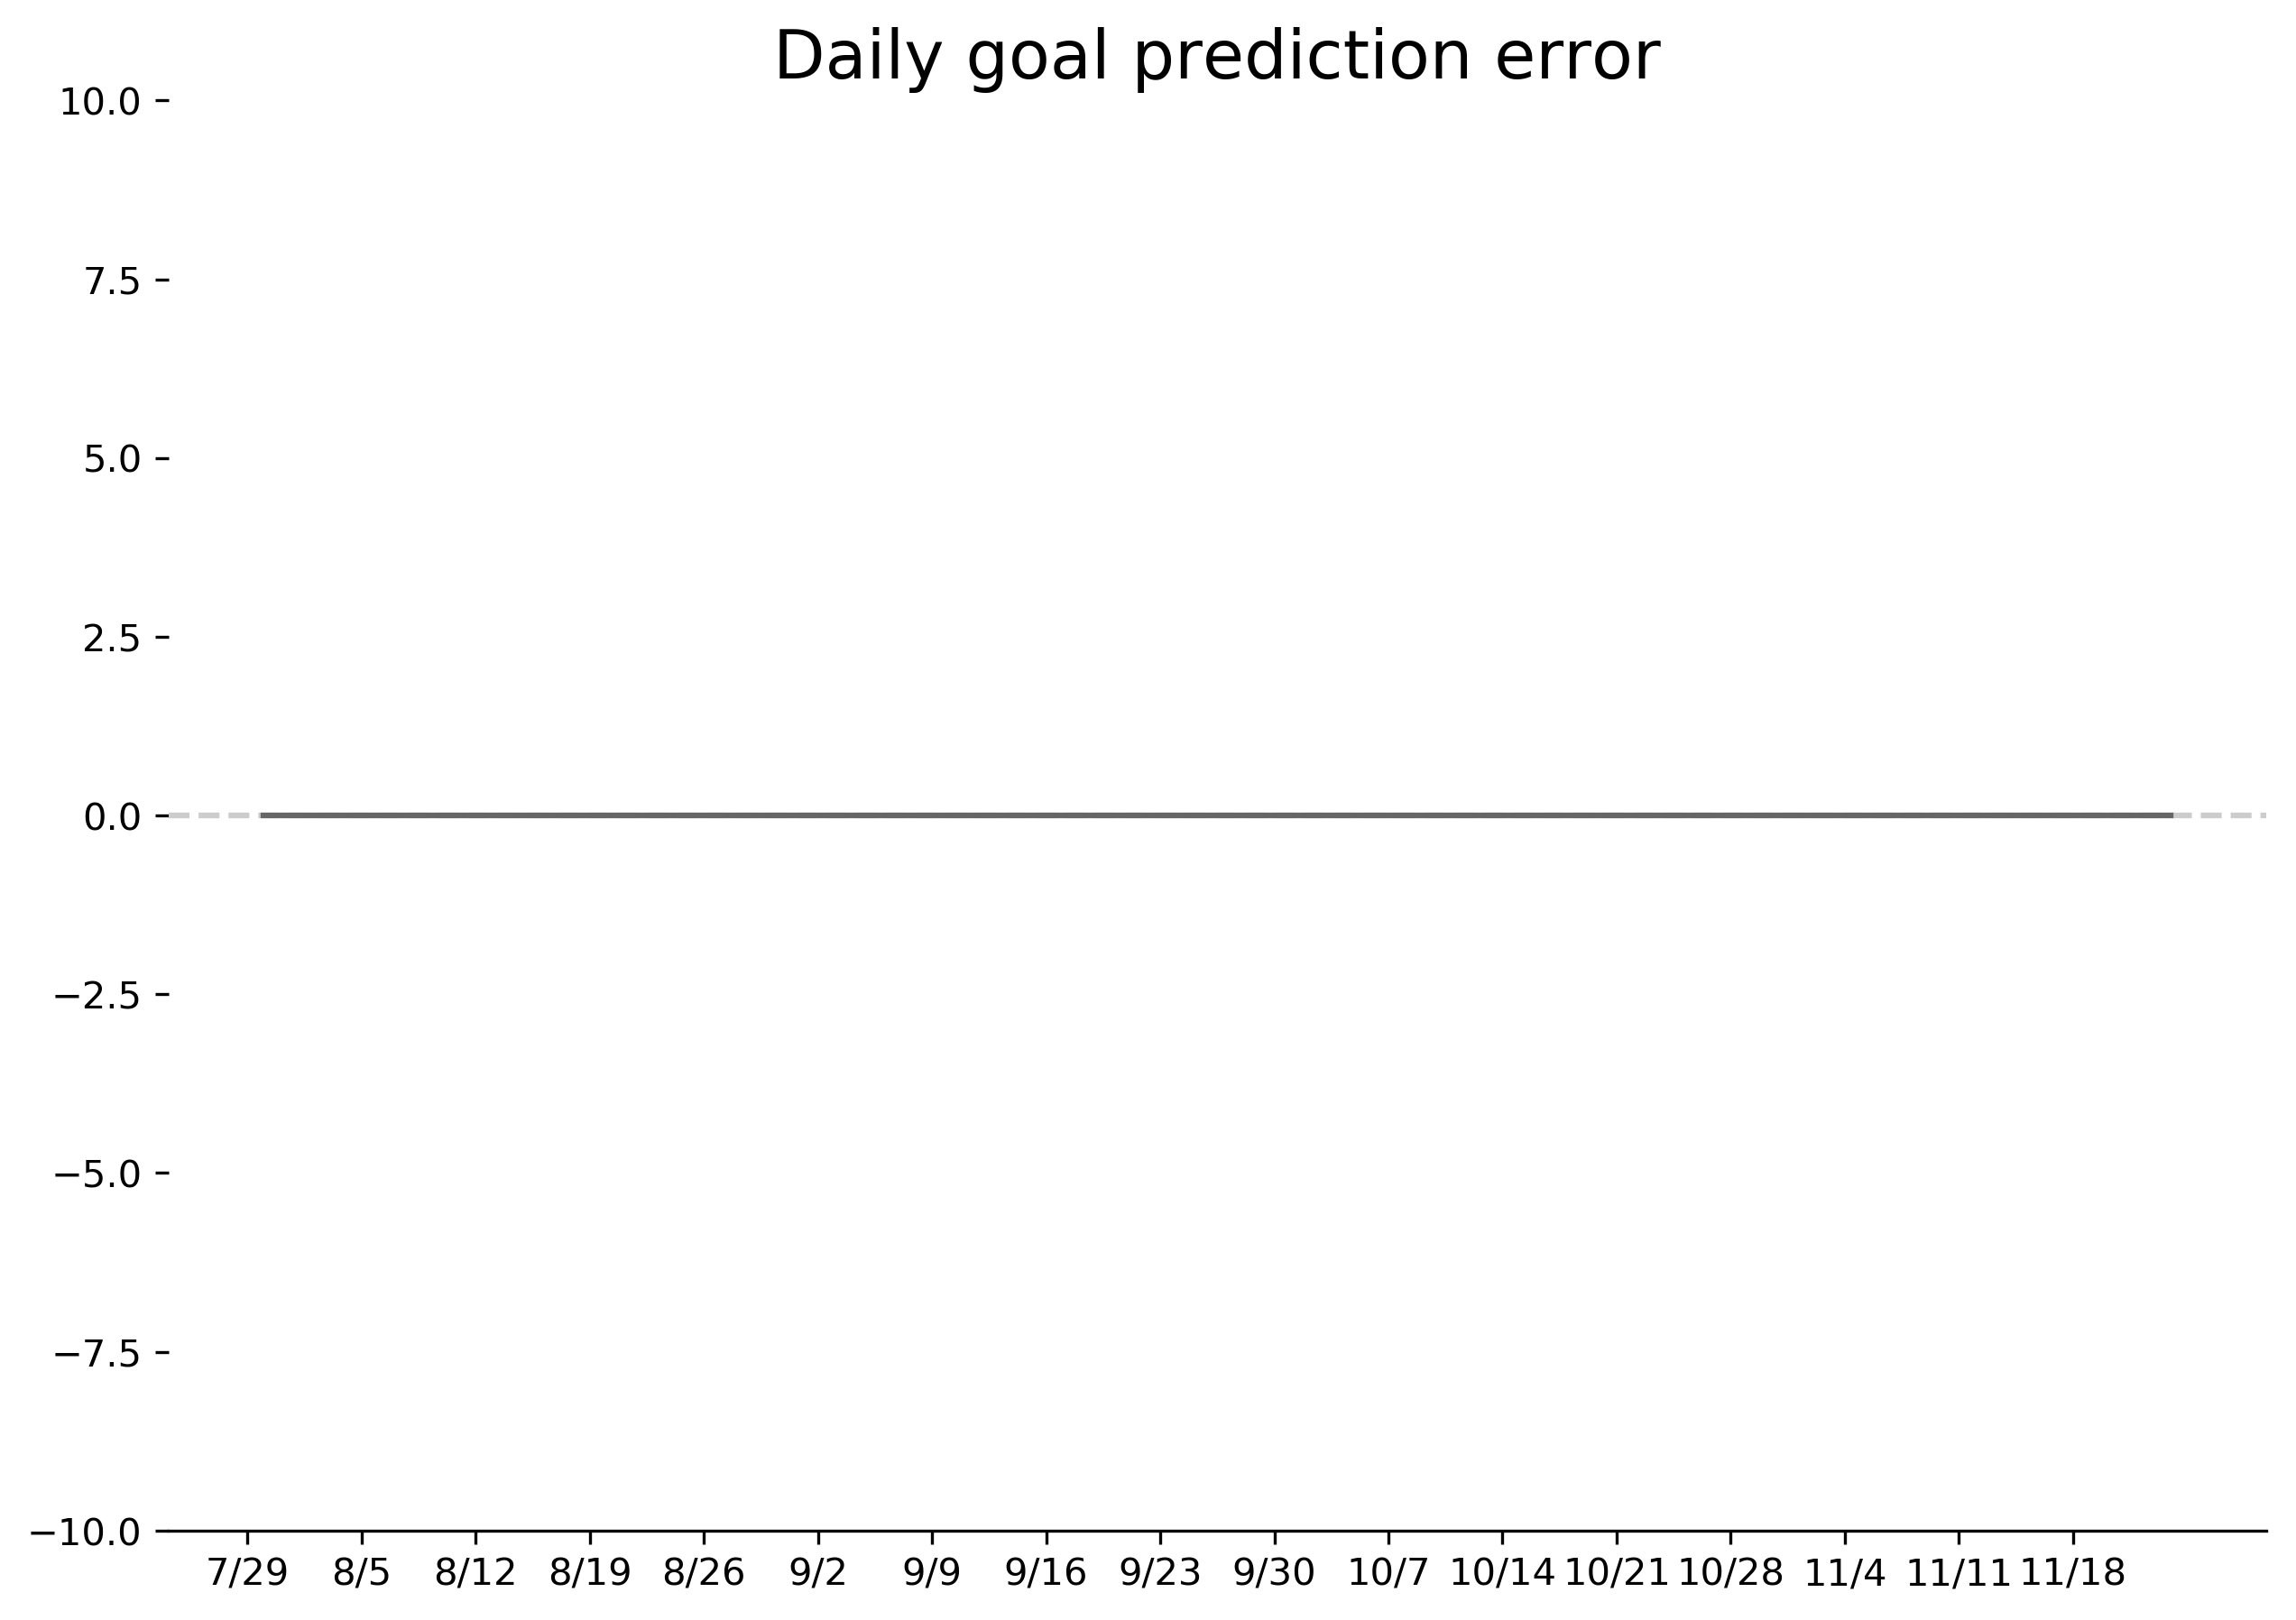
There we have it: perfect predictions of my new daily step goal for every day in the time period. Let's summarize the whole thing from the beginning, in math and code:
where
# read data
data = pd.read_csv('step-data.txt', index_col=0, parse_dates=[0])

# add columns
data['difference'] = data.actual - data.goal
group = [list(g) for k, g in itertools.groupby(data.difference >= 0)]
data['streak'] = [i+1 for x in group for i, v in enumerate(x)]
data['factor'] = 0.1 + (data.streak > 1)*0.1

# implement garmin's algorithm
data['guess'] = np.floor(data.factor * data.difference) + data.goal
data['guess'] = np.ceil(data.guess / 10) * 10
data['guess'] = np.roll(data.guess, 1)
data['guess'].iloc[0] = np.nan

# check accuracy
>>> print((data.guess - data.goal).abs().sum())
0.0
Ceiling and floor nuance aside, I think this algorithm makes sense. It seeks to adjust quickly up or down if you have consistent performance relative to your step goal. I suppose the benefit of the extra steps is that the final result each day is a nice, round number. It also didn't take too much effort to try to reverse engineer Garmin's algorithm (thankfully). In a future post, I'll attempt to feed this data into a machine learning model to see if it can tease out the logic as well. Stay tuned!