Introducing pyesg!
Oct 31, 2019
Introduction
I've started a new project, called pyesg - Python Economic Scenario Generator. Economic Scenario Generators, or ESGs, are used to simulate possible future markets, like stock prices, interest rates, or volatility. Actuaries use ESGs to determine the potential values of insurance portfolios in the future. This helps them ensure that their companies will have enough money to pay claims even under the worst scenarios. Other professionals might use ESGs to understand how business decisions today could affect company value in the future. The Python ecosystem has amazing libraries for data analysis, machine learning, and many other fields, but not for generating economic scenarios. I hope that an ESG library for Python will make this type of analysis easier and more widely adopted.
Today, one of the most widely used economic scenario generators among actuaries is provided for free by the Society of Actuaries and the American Academy of Actuaries. It is an Excel file that is available here. This is a fantastic resource provided by these organizations, but suffers from the classic drawbacks of Excel, including lack of unit-testing, compatibility issues (it is a .xls file, not the more ubiquitous .xlsx or .xlsm files today), and speed issues (it takes roughly 7-8 minutes to generate a full set of scenarios.) One of the goals of pyesg is to provide the same functionality as the Academy generator in a well-tested and fast python package.
Objectives
I'm not aware of any comprehensive ESG library available for Python today. I think such a library should have the following components:
- A suite of stochastic models - inspired by the "fit"/"predict" scikit-learn API
- that are easy to calibrate ("fit") using historical data, or to manually provide parameters.
- that can simulate future economic paths ("predict")
- A suite of model and scenario evaluation tools to
- evaluate the goodness of fit of models
- calculate significance measures of generated scenarios (to select subsets of scenarios if desired)
- Replicate the existing SOA and AAA Excel generator so actuarial teams can migrate to Python.
- Minimal dependencies - relying on the standard scientific python stack:
numpy,pandas, andscipy, with optional plotting frommatplotlib.
I expect that these objectives may shift or expand as I continue working on the library. Please let me know if you think anything is missing!
Example - Vasicek Interest Rate Model
The project is in its early stages, but I've recently implemented the Vasicek interest rate model. At the moment, the API looks like this.
import pyesg

# load a dataset of US Treasury rates, contained in pyesg.datasets, which is a
# pandas dataframe of rates for various maturities, indexed by year and month
ust = pyesg.datasets.load_ust_historical()

# for this example, we'll train on the following data:
# y - the 3-month US treasury rate
# X - the time of each observation, starting at zero, in monthly steps
y = ust.loc['3-month'].values
X = np.full(len(y), 1/12).cumsum()

# create a vasicek model object, just like an estimator model from sklearn
vasicek = pyesg.Vasicek()

# fit the model by passing the X and y vectors; the model is now trained
vasicek.fit(X, y)

# sample future paths from the model
# specify the number of scenarios (e.g. 1000)
# length of projection (e.g. 30 years)
# and time step (e.g. weekly, or 52 time-steps per year)
scenarios = vasicek.sample(size=(1000, 30, 52))
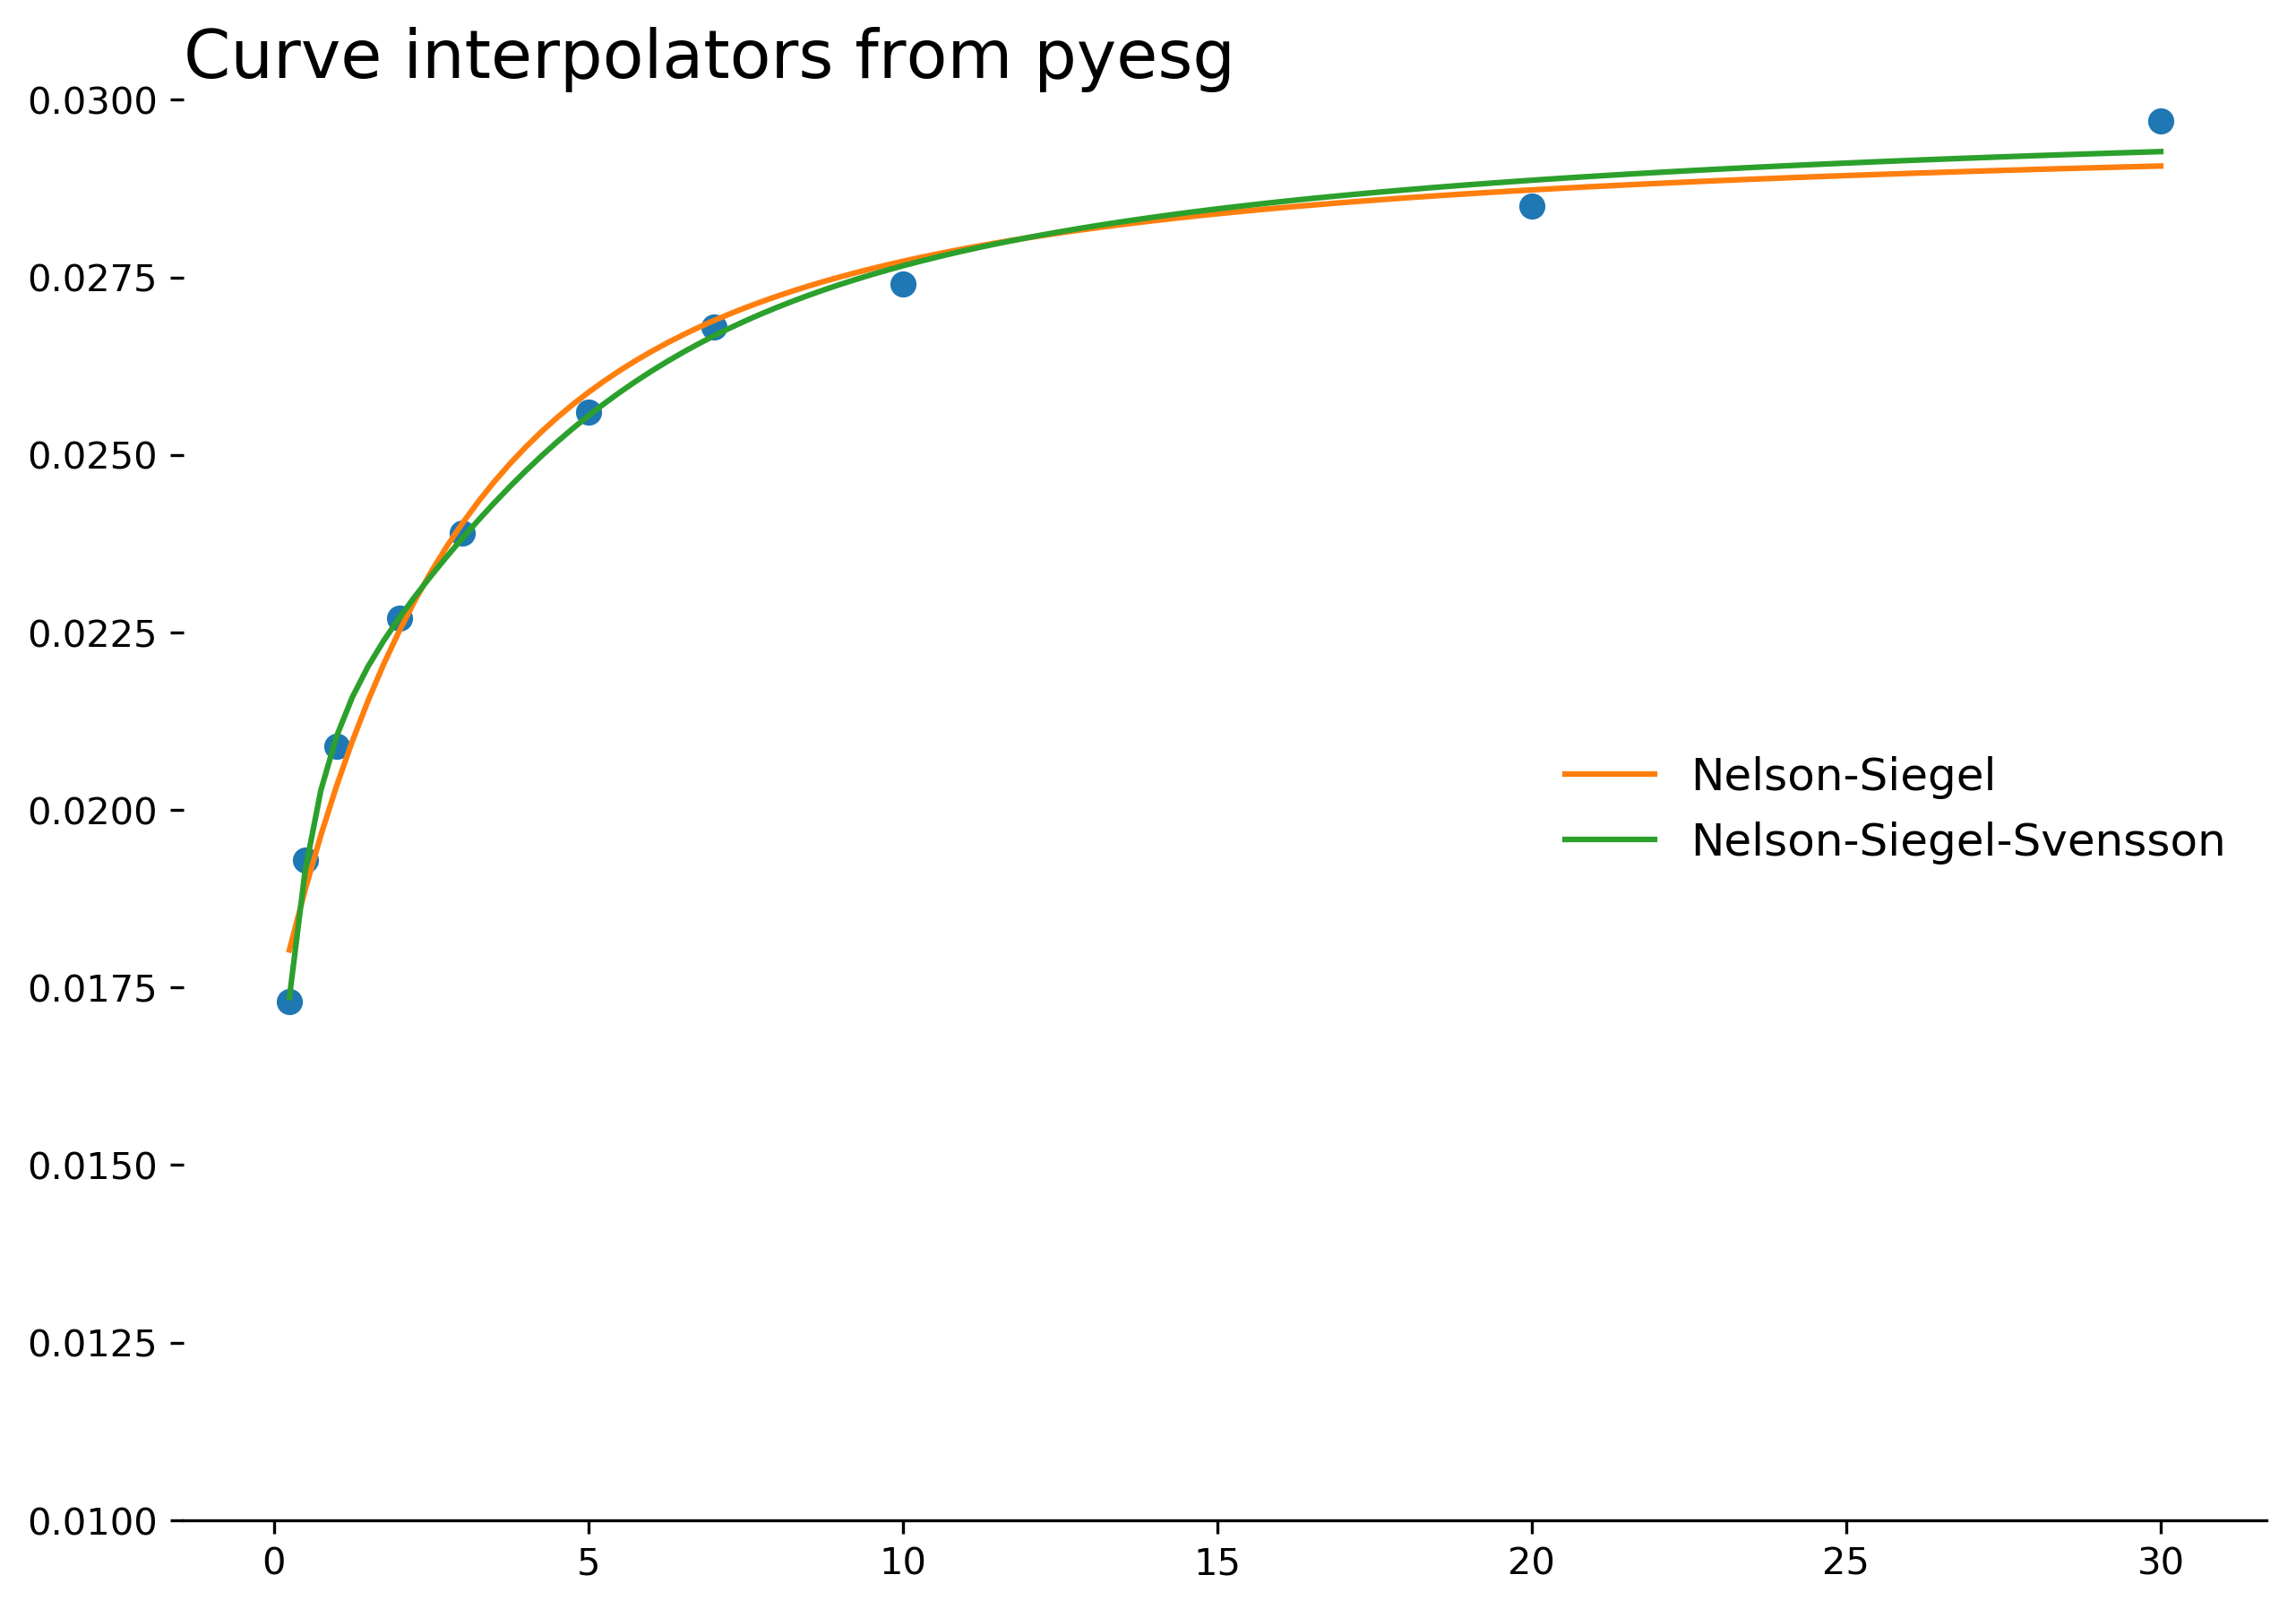
Example - Nelson-Siegel and Nelson-Siegel-Svensson Curve Interpolators
We can almost always observe interest rates at key maturities, for example, bonds trading with maturities of 1, 2, 3, 5, 7, or 10 years. If we want to estimate the interest rate for an 8-year bond, we need to interpolate between the observed values. Simple techniques like linear interpolation are possible, but have certain obvious disadvantages - namely that the interest rate curve is non-linear. Instead, better techniques like the Nelson-Siegel and Nelson-Siegel-Svensson interpolators might give better results. Both interpolators are available in pyesg.
import pyesg
import matplotlib.pyplot as plt


# load a dataset of historical US Treasury rates, contained in pyesg.datasets
# ust is a pandas dataframe of rates for various maturities, indexed by year and month
ust = pyesg.datasets.load_ust_historical()

# we will be interpolating rates from the file:
# y - the observed US Treasury rate for the given maturity for a select observation date
# X - the maturity of the bond measured in years
y = data.iloc[-10].values
X = np.array([0.25, 0.5, 1, 2, 3, 5, 7, 10, 20, 30])

# create Nelson-Siegel and Nelson-Siegel-Svensson interpolator objects
# then fit both models using the historical data
ns = pyesg.NelsonSiegel()
nss = pyesg.NelsonSiegelSvensson()
ns.fit(X, y)
nss.fit(X, y)

# finally, we can plot the results
fig, ax = plt.subplots(figsize=(10,7))

x = np.arange(1, 121) / 4
ax.plot(x, ns.predict(x), color='C1', label='Nelson-Siegel')
ax.plot(x, nss.predict(x), color='C2', label='Nelson-Siegel-Svensson')
ax.scatter(X, y)

ax.legend(frameon=False, fontsize=12)
for s in ['top', 'right', 'left']:
    ax.spines[s].set_visible(False)
plt.show()
Progress
The pyesg package is available on pypi, and can be installed quickly using:
pip install pyesg
The source code is available on github, and is open-source licensed under MIT.
If this project sounds interesting to you, I would love to hear your thoughts! I would also welcome contributions. You can reach me at jason@ashanalytics.com.