Riddler League Baseball
Sep 27, 2019
Introduction
What happens when you create a baseball league from three teams with peculiar specialties? That's the objective of this week's Riddler. We're asked to determine whether it's better to specialize in home runs, doubles, or walks as a strategy to tally the most wins from a season of baseball in the Riddler League.
We've seen similar problems from the Riddler about baseball simulations, but this one has a competitive twist - simulating an entire season of games among a full League of teams. Here's the full problem text.
Riddler League Baseball, also known as the RLB, consists of three teams: the Mississippi Moonwalkers, the Delaware Doubloons and the Tennessee Taters.Each time a batter for the Moonwalkers comes to the plate, they have a 40 percent chance of getting a walk and a 60 percent chance of striking out. Each batter for the Doubloons, meanwhile, hits a double 20 percent percent of the time, driving in any teammates who are on base, and strikes out the remaining 80 percent of the time. Finally, each batter for the Taters has a 10 percent chance of hitting a home run and a 90 percent chance of striking out.
During the RLB season, each team plays an equal number of games against each opponent. Games are nine innings long and can go into extra innings just like in other baseball leagues. Which of the three teams is most likely to have the best record at the end of the season?
Solution
It turns out that swinging for the fences is a viable strategy in Riddler League Baseball. The Taters, who hit home runs with 10% of their batting attempts, are able to win a decisive victory against their opponents. The table below shows the win rates for each potential matchup in the League, based on simulating 10 million games between each pair of teams. (Note there is no actual home field advantage, but assigning teams to "home" and "away" helps clarify which team has the better odds of winning.)
The Taters have a clear advantage over the Doubloons, winning over 62% of their games against that team. The closest matchup is between the Taters and the Moonwalkers - teams with seemingly polar opposite game plans.
| Home Team | Away Team | Home team win % |
|---|---|---|
| Taters | Doubloons | 62.73% |
| Moonwalkers | Doubloons | 58.49% |
| Taters | Moonwalkers | 51.62% |
If we simulate a season of 162 games using the win rates from the table above, we get the following records for each team. For example, the Taters are expected to play the Doubloons 81 times and the Moonwalkers 81 times. They win 62.73% of their 81 games against the Doubloons and 51.62% of their 81 games against the Moonwalkers for a total of wins for the season. We calculate wins and losses similarly for each other team.
| Team | Expected Wins | Expected Losses |
|---|---|---|
| Taters | 92.6 | 69.4 |
| Moonwalkers | 86.6 | 75.4 |
| Doubloons | 63.8 | 98.2 |
Methodology
How did we calculate the win percentages? We want to tally the number of runs scored by each team during a game, which is the sum of the runs scored during each of nine innings. How many runs might each of our teams score in a single inning?
- Taters: Each batter has a 10% chance of scoring a single run. We want to count the number of runs scored before the third out is recorded.
- Doubloons: The inning starts with bases empty. Once the first player hits a double, the next batter drives in a run if he also hits a double. Furthermore, every subsequent batter also drives in a run with a double, because strikeouts don't affect baserunners. Therefore, if the Doubloons have three doubles in an inning, we know they have scored two runs.
- Moonwalkers: Similar to the Doubloons, the Moonwalkers score runs for each walk after the first three walks. If they have seven walks in an inning, we know they scored four runs.
Suppose we want to calculate the likelihood that the Doubloons score three runs in a single inning. We know they need four hits before the third out. They get a single hit with 20% odds, so four hits occurs with probability . We also need three outs, which occurs with probability . The order of hits and outs doesn't matter (as long as all four hits occur before the third out), so we can account for each valid ordering by adding a combinatorial term, . We multiply all three components together for the overall probability of three runs:
This process of counting a number of occurrences before a terminal event (e.g. "3 outs") is modeled by a Negative Binomial distribution. In this case, we'll use the distribution to count the number of hits (or walks). However, we need to translate hits into runs for each team, so we'll make a slight modification: for the Doubloons we'll subtract one; for the Moonwalkers, we'll subtract three.
We can build Negative Binomial distributions in Python using the scipy.stats library. Our trick will be to shift each distribution by the number of hits (or walks) required to prime the bases for future runs, using the loc attribute of each distribution. For the Doubloons, we shift the distribution left by one position; for the Moonwalkers, we shift left by three positions. Then, if the distribution ever returns a negative number, it means we didn't have enough hits to score any runs, so we return a zero for the inning.
from scipy.stats import nbinom

# mississippi moonwalkers: walks 40% of the time
# delaware doubloons: doubles 20% of the time
# tennessee taters: home runs 10% of the time
MOONWALKERS = nbinom(n=3, p=0.6, loc=-3)
DOUBLOONS = nbinom(n=3, p=0.8, loc=-1)
TATERS = nbinom(n=3, p=0.9, loc=0)
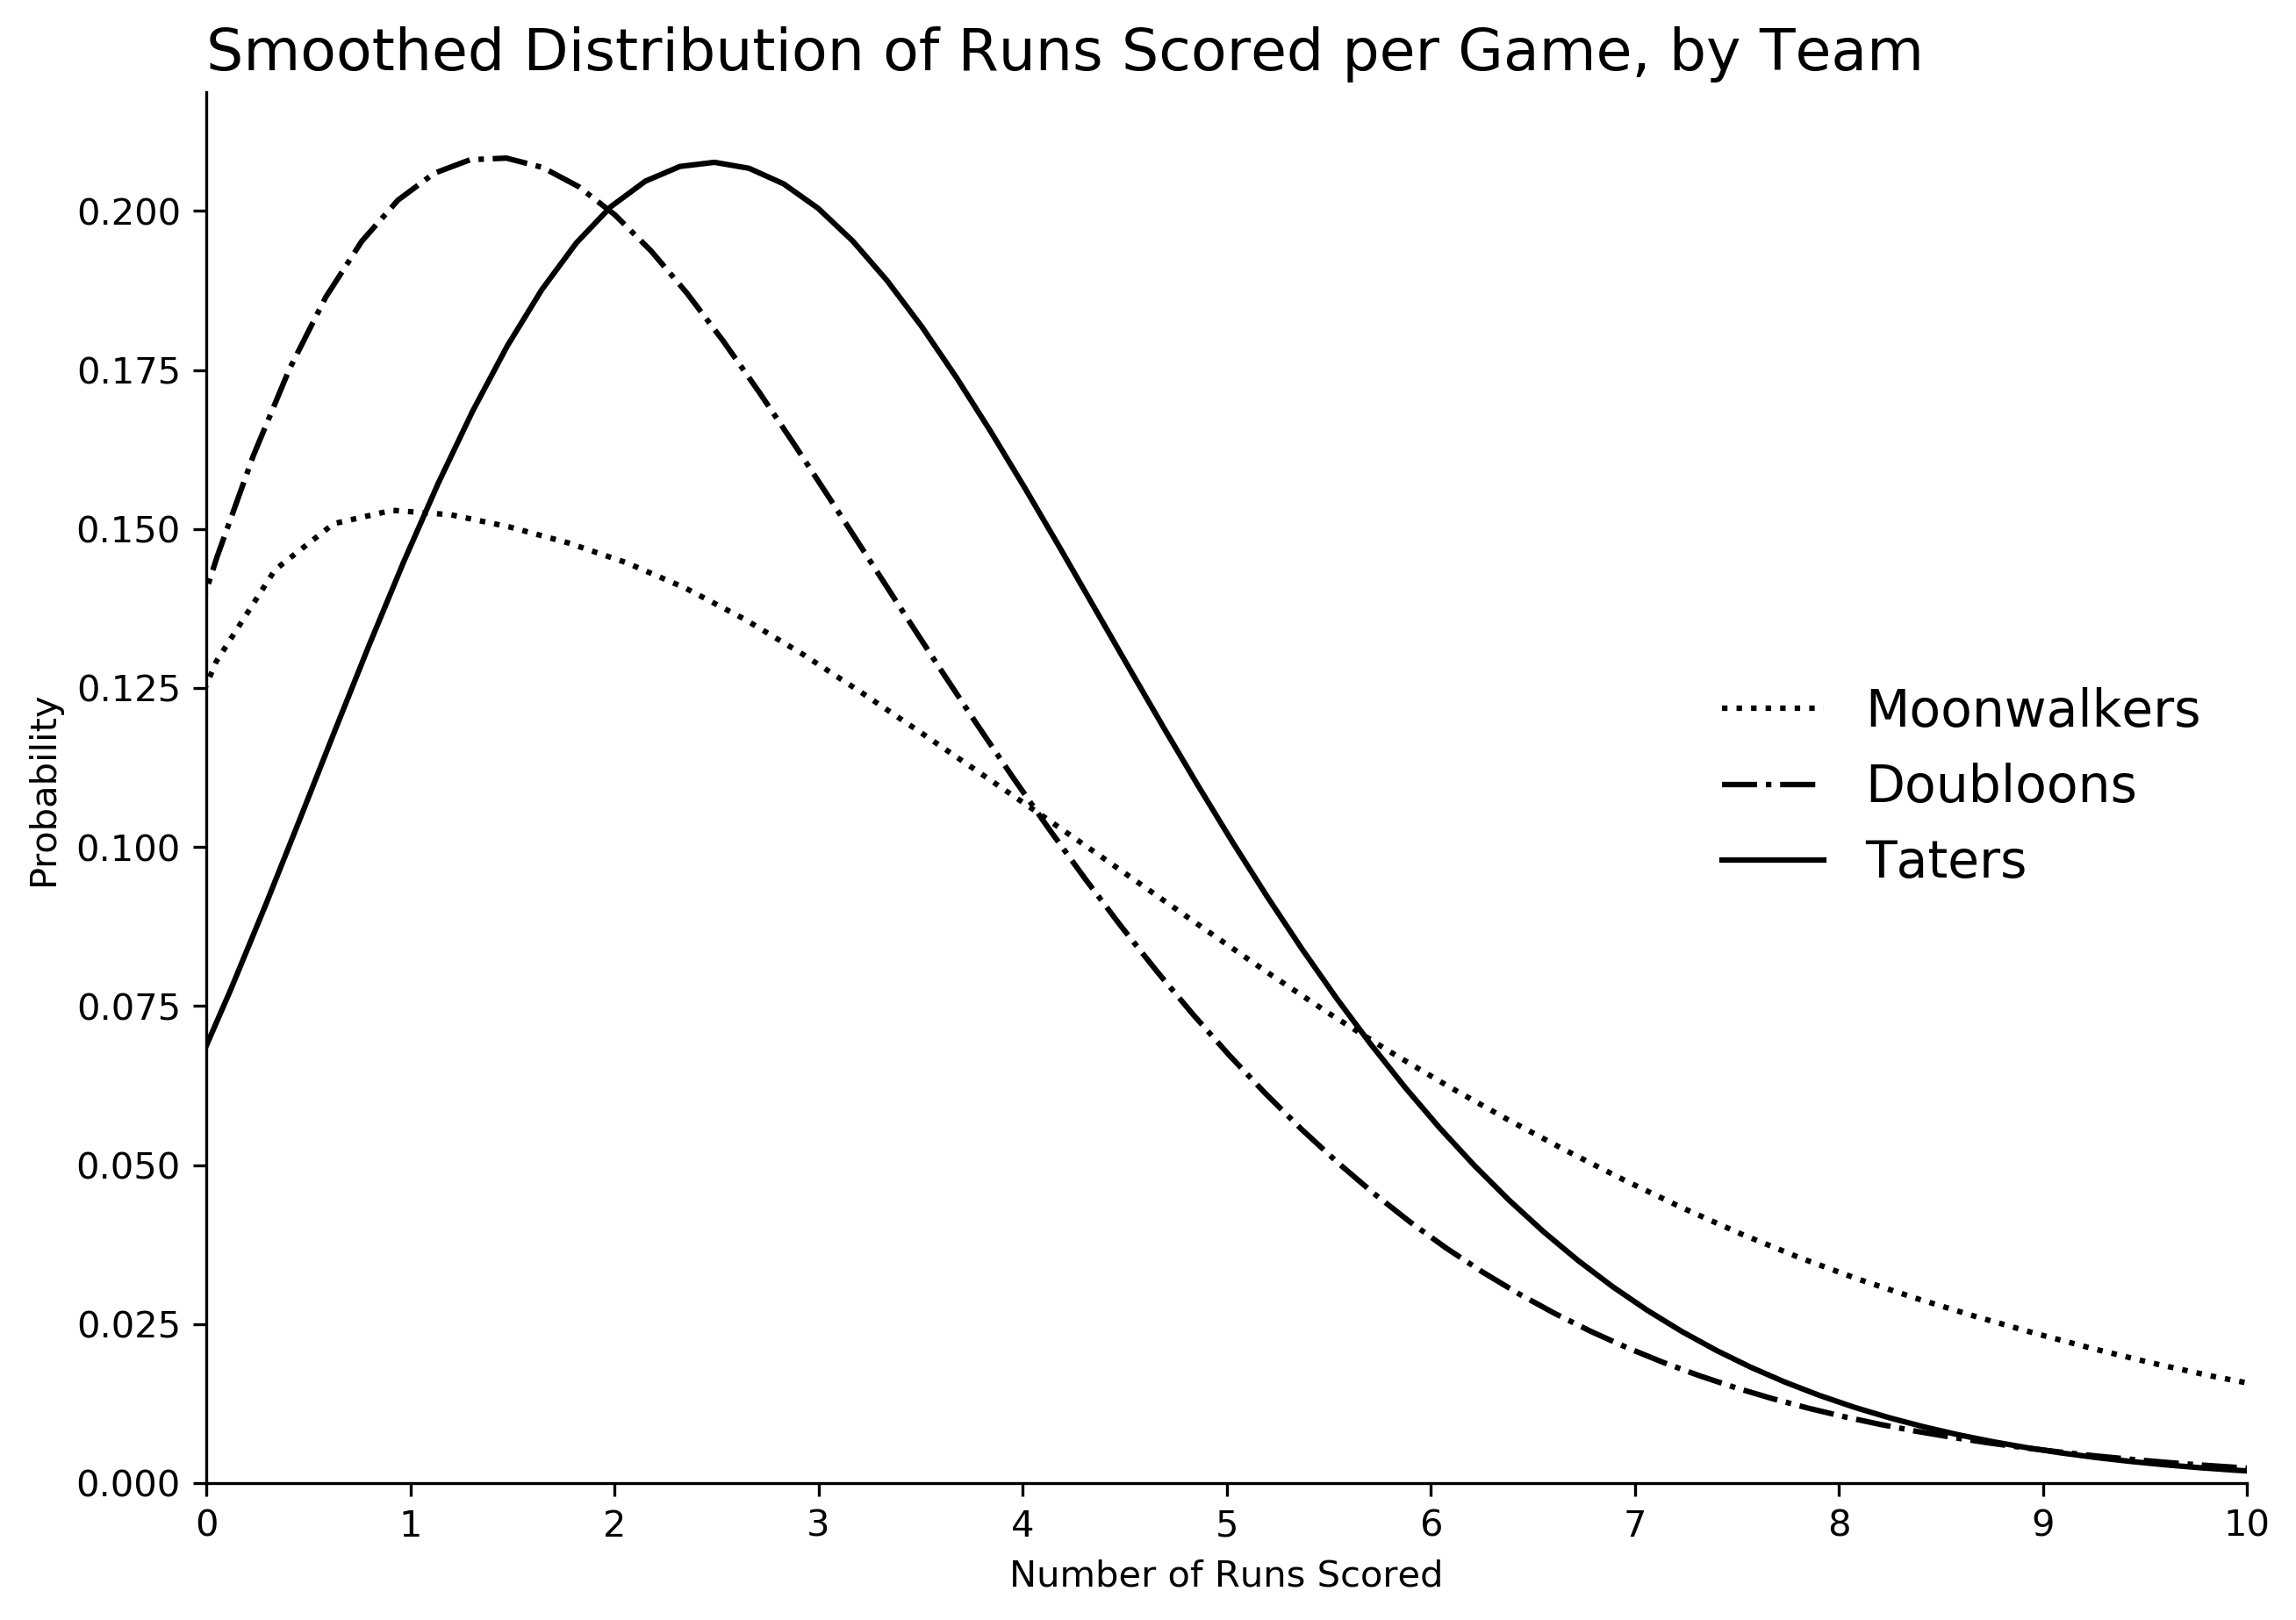
The number of runs scored during a full game is the sum of runs scored during nine innings. We draw random samples from the distributions using the .rvs() method attached to the nbinom distributions for runs scored in each inning, then sum across all innings for the final tally. Below, I've shown smoothed distributions of the number of runs scored by each team during a full 9-inning game (not including extra innings.)
The distribution shows us that the Taters consistently score between one to five runs per game, enough to beat the average performance from the Doubloons and Moonwalkers. However, the Moonwalkers have the potential for high-scoring slugfests, er, walkfests. They might not be the most exciting team, but they are actually competitive against the Taters, winning roughly 49% of their games.
def game_score(team, innings=9, games=1000000):
    """
    Returns random samples of the number of runs scored during a
    single game, for the number of trials, default 1 million.

    Parameters
    ----------
    team : a "team" is represented by a negative binomial distribution
        object from scipy.stats. It describes the likelihood of scoring
        various numbers of runs during an inning
    """
    return np.maximum(0, team.rvs((games, innings))).sum(1)
Now that we can sample from the distribution of runs scored per game, we can pit the teams against one another. Adding a bit of extra logic to handle ties, we are able to calculate the win percentages we showed above. I was also interested in testing how well the teams performed in sudden death. Was any team able to sneak wins from a better opponent if they had just one inning? The percentages suggest not - each team performs roughly the same whether it's a full 9-inning game or a sudden death tiebreaker.
| Home Team | Away Team | Home team win % | Sudden Death win % |
|---|---|---|---|
| Taters | Doubloons | 62.73% | 61.17% |
| Moonwalkers | Doubloons | 58.49% | 59.59% |
| Taters | Moonwalkers | 51.62% | 51.09% |
Full Code
import numpy as np
from scipy.stats import nbinom


# mississippi moonwalkers: walks 40% of the time
# delaware doubloons: doubles 20% of the time
# tennessee taters: home runs 10% of the time
MOONWALKERS = nbinom(n=3, p=0.6, loc=-3)
DOUBLOONS = nbinom(n=3, p=0.8, loc=-1)
TATERS = nbinom(n=3, p=0.9, loc=0)


def game_score(team, innings=9, games=1000000):
    """
    Returns random samples of the number of runs scored during a
    single game, for the number of trials, default 1 million.

    Parameters
    ----------
    team : a "team" is represented by a negative binomial distribution
        object from scipy.stats. It describes the likelihood of scoring
        various numbers of runs during an inning
    """
    return np.maximum(0, team.rvs((games, innings))).sum(1)

def win_rate(team, other, innings=9, games=1000000, random_state=None):
    """
    Returns random samples of the number of runs scored during a
    single game, for the number of trials, default 1 million.

    Parameters
    ----------
    team : a "team" is represented by a negative binomial distribution
        object from scipy.stats. It describes the likelihood of scoring
        various numbers of runs during an inning
    other : the opponent, another "team", distribution object
    """
    np.random.seed(random_state)

    # play all nine innings, then count number of wins
    team_score = game_score(team, innings=innings, games=games)
    other_score = game_score(other, innings=innings, games=games)
    team_wins = (team_score > other_score).sum()
    other_wins = (other_score > team_score).sum()

    # play extra innings for any ties, continue until no more ties
    while team_wins + other_wins < games:
        team_score = game_score(team, innings=1, games=games - team_wins - other_wins)
        other_score = game_score(other, innings=1, games=games - team_wins - other_wins)
        team_wins += (team_score > other_score).sum()
        other_wins += (other_score > team_score).sum()

    return team_wins / games

def summary(games=1000000, random_state=None):
    np.random.seed(random_state)
    taters_doubloons = win_rate(TATERS, DOUBLOONS, games=games)
    moonwalkers_doubloons = win_rate(MOONWALKERS, DOUBLOONS, games=games)
    taters_moonwalkers = win_rate(TATERS, MOONWALKERS, games=games)
    table = (
        f'| Home Team   | Away Team   | Home team win % |\n'
        f'|:------------|:------------|:----------------|\n'
        f'| Taters      | Doubloons   | {taters_doubloons:.2%} |\n'
        f'| Moonwalkers | Doubloons   | {moonwalkers_doubloons:.2%} |\n'
        f'| Taters      | Moonwalkers | {taters_moonwalkers:.2%} |\n'
    )
    return table

print(summary(games=10000000, random_state=42))